Association Rules with R
Market Basket Analysis with R
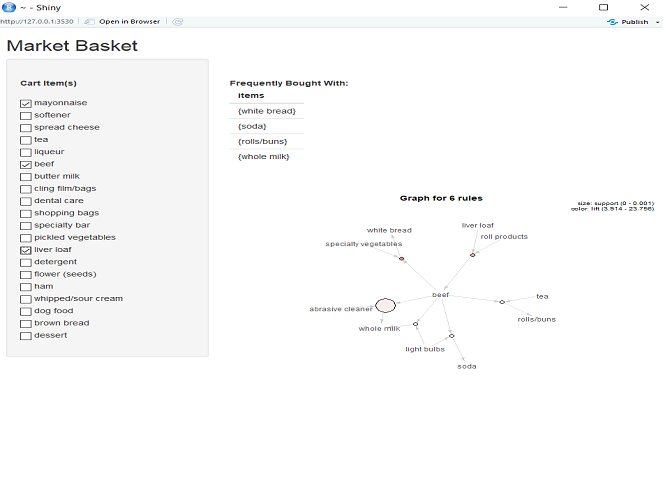
Doing Market Basket Analysis using Apriori Algorithm to recommend items that are frequently bought together to do up-sale using R and deploying the model in a Shiny App.
Github Link: https://github.com/MNoorFawi/association-rules-with-R
suppressMessages(library(arules))
data("Groceries")
summary(Groceries)
## transactions as itemMatrix in sparse format with
##  9835 rows (elements/itemsets/transactions) and
##  169 columns (items) and a density of 0.02609146
##
## most frequent items:
##       whole milk other vegetables       rolls/buns             soda
##             2513             1903             1809             1715
##           yogurt          (Other)
##             1372            34055
##
## element (itemset/transaction) length distribution:
## sizes
##    1    2    3    4    5    6    7    8    9   10   11   12   13   14   15
## 2159 1643 1299 1005  855  645  545  438  350  246  182  117   78   77   55
##   16   17   18   19   20   21   22   23   24   26   27   28   29   32
##   46   29   14   14    9   11    4    6    1    1    1    1    3    1
##
##    Min. 1st Qu.  Median    Mean 3rd Qu.    Max.
##   1.000   2.000   3.000   4.409   6.000  32.000
##
## includes extended item information - examples:
##        labels  level2           level1
## 1 frankfurter sausage meat and sausage
## 2     sausage sausage meat and sausage
## 3  liver loaf sausage meat and sausage
ar <- apriori(Groceries,
              parameter = list(
                support = 0.001,
                confidence = 0.6,
                maxlen = 10
              ),
              control = list(verbose = FALSE))
inspect(sample(ar, 6))
##     lhs                     rhs                    support confidence     lift
## [1] {frankfurter,
##      yogurt,
##      sliced cheese}      => {whole milk}       0.001016777  0.8333333 3.261374
## [2] {tropical fruit,
##      curd,
##      yogurt,
##      whipped/sour cream} => {whole milk}       0.001321810  0.7647059 2.992790
## [3] {sausage,
##      curd,
##      pastry}             => {other vegetables} 0.001016777  0.7142857 3.691540
## [4] {chicken,
##      citrus fruit,
##      whipped/sour cream} => {yogurt}           0.001016777  0.6666667 4.778912
## [5] {whole milk,
##      butter,
##      waffles}            => {other vegetables} 0.001423488  0.7777778 4.019677
## [6] {pip fruit,
##      root vegetables,
##      yogurt}             => {whole milk}       0.003558719  0.6730769 2.634187
subs <- subset(ar,
               subset = lhs %in% c("meat", "pasta"))
subs <- sort(subs, by = "confidence")
subs
## set of 16 rules
redundant <- which(colSums(is.subset(subs, subs)) > 1)
length(redundant)
## [1] 2
subs <- subs[-redundant]

recs <- unique(rhs(sort(subs, by = "lift")))
inspect(recs)
##     items
## [1] {other vegetables}
## [2] {whole milk}
suppressMessages(library(arulesViz))
plot(subs, method = "graph")

plot(subs)

plot(subs, method = "grouped")

library(shiny)
runApp("App.R")

Leave a Reply