Data Visualization
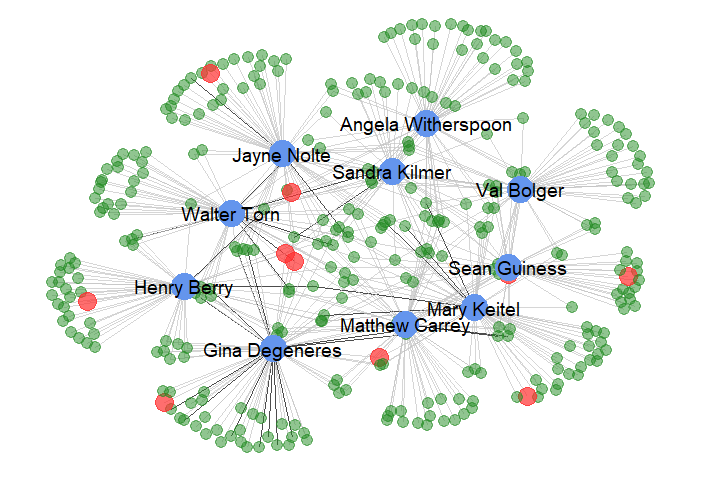
Network Visualization with R
Visualizing Networks using different R packages (igraph, visNetwork, ggnet2) The data is taken from DVD Rental database which consists of three columns: customer name, number of rentals each customer rented…
Read more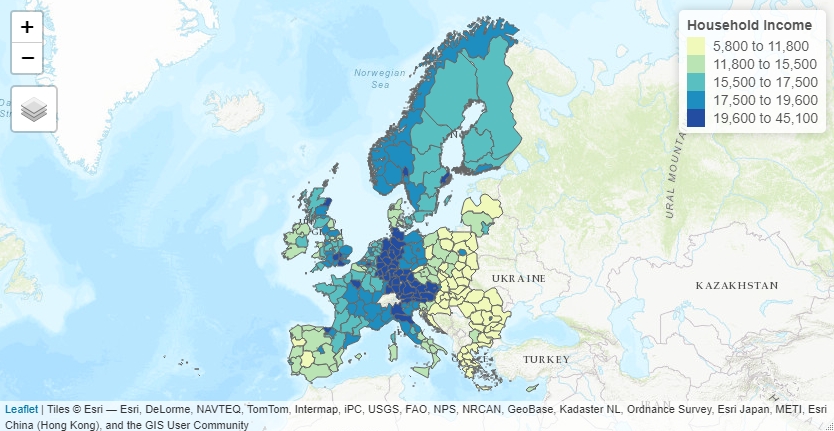
Drawing Maps with R
Using R to draw and visualize data on maps with different libraries. Github link: https://github.com/MNoorFawi/drawing-maps-with-r ggmap suppressMessages(library(caret)) suppressMessages(library(dplyr)) suppressMessages(library(ggmap)) data("Sacramento") ## stamen map scrmnt <- c(left = min(Sacramento$longitude), bottom =…
Read more