data-visualization
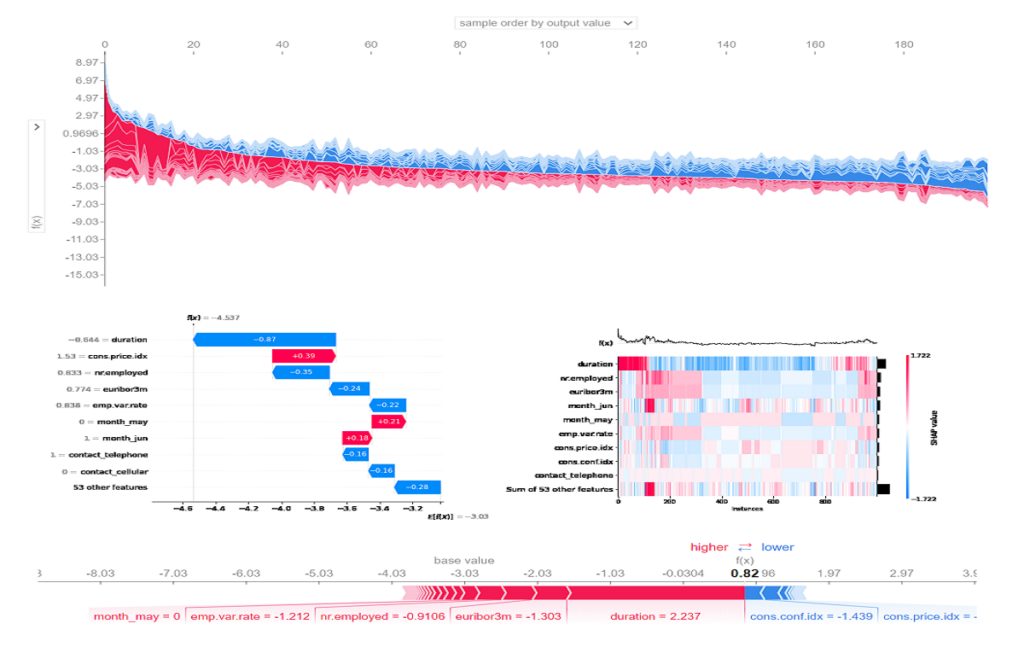
Explain Python Machine Learning Models with SHAP Library
Using SHapley Additive exPlainations (SHAP) Library to Explain Python ML Models Almost always after developing an ML model, we find ourselves in a position where we need to explain this…
Read more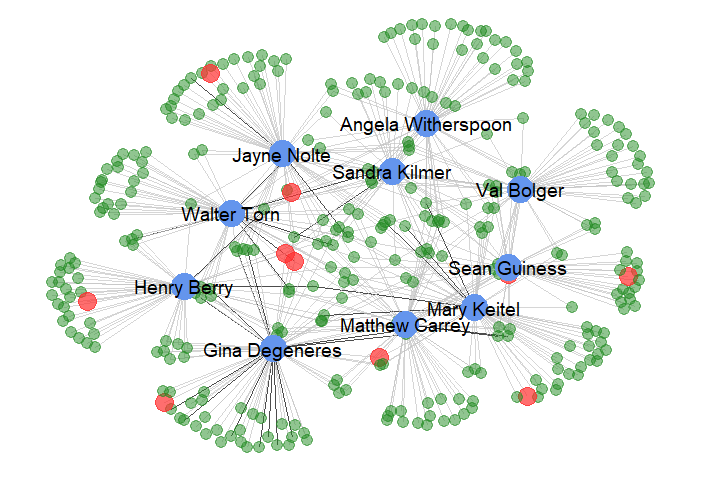
Network Visualization with R
Visualizing Networks using different R packages (igraph, visNetwork, ggnet2) The data is taken from DVD Rental database which consists of three columns: customer name, number of rentals each customer rented…
Read more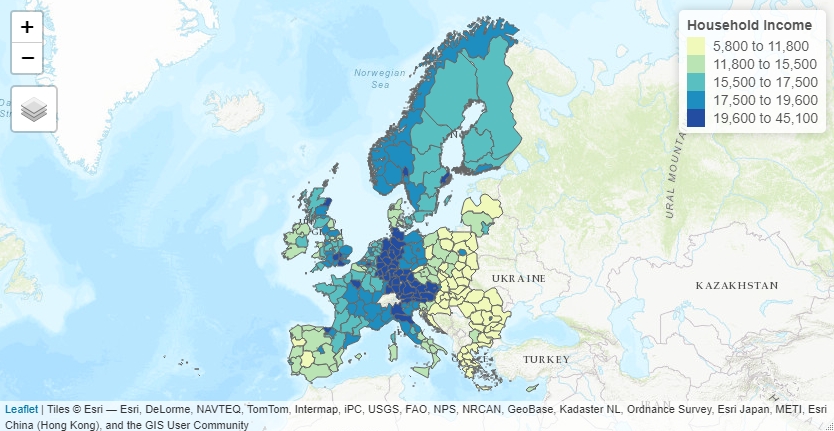
Drawing Maps with R
Using R to draw and visualize data on maps with different libraries. Github link: https://github.com/MNoorFawi/drawing-maps-with-r ggmap suppressMessages(library(caret)) suppressMessages(library(dplyr)) suppressMessages(library(ggmap)) data("Sacramento") ## stamen map scrmnt <- c(left = min(Sacramento$longitude), bottom =…
Read more