Importing & Cleaning Data (in Parallel) with Command Line
Importing data from APIs sometimes isn’t easy especially when we want to import so much data, as we’ll have to make so many requests to the API. This can take so much time if we do it sequentially. In such cases, going parallel is of great help.
Github Link: https://github.com/MNoorFawi/data-manipulation-in-parallel-using-command-line
Parallelism is about distributing all the processes to be executed over the CPU cores in order for them to be executed simultaneously. Data Parallelism is a great technique in data science problems as it helps save great amount of time when it comes to executing commands over so large data. Here we’re going to explore how we can connect to a web API, import data in parallel, clean it and then write it into disk using the command line. I personally love the Command Line, it is not only so efficient, using it is so much fun and it is able to do magic work as well.
This piece of work is inspired by Data Science at the Command Line Book
We’re going to get the temperature of som capitals around the whole world using the Open Weather Map API https://openweathermap.org/api
You’ll need to sign up to get an api-key to use it to retrieve data.
let’s get down to business.
this is a regular call to the api and its result.
curl -s 'http://api.openweathermap.org/data/2.5/weather?q=rome&appid=<your-api-key>'

# {"coord":{"lon":-85.1647,"lat":34.257},
#  "weather":[{"id":741,"main":"Fog","description":"fog","icon":"50n"}],
#  "base":"stations","main":{"temp":271.15,"feels_like":268.02,"temp_min":270.37,"temp_max":272.15,"pressure":1023,"humidity":93},
#  "visibility":402,"wind":{"speed":1.07,"deg":281},"clouds":{"all":90},
#  "dt":1610523411,"sys":{"type":1,"id":5680,"country":"US","sunrise":1610542002,
#  "sunset":1610578308},"timezone":-18000,"id":4219762,"name":"Rome","cod":200}
so many data !!! and we’re now and almost all the time not interested in all these data. we sometimes want some elements.
so we’re going to use some wonderful command line tools to get only the data we want. here we want name and temp values.
N.B. these values change every moment as the temperature change in these cities, so when you’ll try this yourself it might give you other results.
let’s get the data we want in parallel and clean it adnd write it to disk.
< cities.txt tr ' ' '+' |
parallel -j400% --progress -C "\n" 'curl -s "http://api.openweathermap.org/data/2.5/weather?q={}&appid=<api-key>"' |
jq -r '{name: .name, temperature: .main.temp} | [.name, .temperature] | @csv' |
awk -F, '{print $1","$2-273.15}' |
sed '1i city,temperature' |
csvsql --query 'SELECT * FROM stdin ORDER BY temperature DESC;' > temp.csv

## Computers / CPU cores / Max jobs to run
## 1:local / 12 / 45
##
## Computer:jobs running/jobs completed/%of started jobs/Average seconds to complete
## local:0/45/100%/0.1s
now we have connected and requested data in parallel from a web api, cleaning the data, doing some transformation on it and writing it to disk with almost five lines of code.
let’s check the data we have and then explain the code chunk by chunk.
< temp.csv head -n 6 | csvlook

# | city         | temperature |
# | ------------ | ----------- |
# | Canberra     |       31.51 |
# | Jakarta      |       28.97 |
# | Kuala Lumpur |       28.94 |
# | Bangkok      |       27.63 |
# | Manila       |       27.55 |
so let’s explain the code;GREAT !!! we now have only the cities and its celsius degree of temperature sorted descreasingly.
- < cities.txt tr ‘ ‘ ‘+’
here we have the cities.txt file as input and replace the spaces with + sign to use them the url we’ll send to the api using the tr command line tool.
- parallel -j400% –progress -C “\n” ‘curl -s “http://api.openweathermap.org/data/2.5/weather?q={}&appid=your-api-key”‘
here we tell the command line to do the following command in parallel using 400% of the CPU cores as the number of parallel jobs, i.e, if a machine has 4 cores so it will run 16 jobs in parallel. –progress command to give me the information as it proceeds. -C, column separator, to separate the input as it is treated as a table. So for example, if we have this example.txt file:
A,1
B,2
C,3
D,4
E,5
We only need to do something with the second column only, let’s say “echo”. So, we specify as the column separator as “,” and specify that we need only the second variable in the command like that:
< example.txt parallel -C ',' 'echo {2}'

# 1
# 2
# 3
# 4
# 5
You can install parallel in linux using: “sudo apt install parallel”
- jq -r ‘{name: .name, temperature: .main.temp} | [.name, .temperature] | @csv’
here we use jq tool to extract only the fields we want from the json result and convert it into an array then convert the array into csv format.
You can install jq in linux using: “sudo apt install jq”
Some other common usage of jq:
# sample.txt has the output from a normal call to the api

# extract a value from inside a list within json
jq '{name: .name, temperature: .main.temp, weather: .weather[].description}' sample.txt

#{
#  "name": "Rome",
#  "temperature": 271.14,
#  "weather": "fog"
#}


# to output array of json objects with jq
< sample.txt jq '{name: .name, temperature: .main.temp, weather: .weather[].description}' | jq -s '.'

#[
#  {
#    "name": "Rome",
#    "temperature": 271.14,
#    "weather": "fog"
#  }
#]
- awk -F, ‘{print $1″,”$2-273.15}’
Getting the Celsius degree of the temperature as it comes in Kelvin. Note that “-F,” determines the separator in data.
Another use for AWK can be to filter data based on a condition:
< temp.csv awk -F, '{if ($2 <= 1.0) {print $1","$2}}'

# Warsaw,0.06
# Ottawa,-1.05
# Rome,-1.14
# Moscow,-11.67
- sed ‘1i city,temperature’
Add a header to the result using sed command. N.B. Normally when inserting using “sed” we use in-place argument “-i”, but here as data comes from pipe we don’t use it.
- csvsql –query ‘SELECT * FROM stdin ORDER BY temperature DESC;’ > temp.csv
Sort the data using SQL commands and write all the results to temp.csv file.
You can install csvkit in linux using: “pip3 install csvkit”
All of these steps can be wrapped into an executable script and run as one command. We will add the following code into “temp_fetch.sh” file:
#!/usr/bin/env bash
# Here is how to run it
# < cities.txt ./temp_fetch.sh <your-api-key>
API_KEY="$1"
tr ' ' '+' |
parallel -j400% --progress -C "\n" 'curl -s "http://api.openweathermap.org/data/2.5/weather?q={}&appid='$API_KEY'"' |
jq -r '{name:.name,temperature:.main.temp} | [.name,.temperature] | @csv' |
awk -F, '{print $1","$2-273.15}' |
sed '1i city,temperature' |
csvsql --query 'SELECT * FROM stdin ORDER BY temperature DESC;' | tee temp.csv |
head -n 6 | csvlook
The script will take the cities file as input along with the api key as an argument. N.B. “tee” command copies the stdin to a file.
The command will also prints an excerpt from the file at the end.
To make the script executable we run: “chmod +x temp_fetch.sh” and then run it as instructed in the file.
now as we have the data we can do further analysis using our favorite language, which is the command line as well in my case!
so we’ll now read the data into R, summarize it and plot a bar plot of the cities and their temperature degrees
library(scales)
library(ggplot2)

temp <- read.csv('temp.csv', sep = ',',
                 header = TRUE, stringsAsFactors = FALSE)
summary(temp)

##      city            temperature
##  Length:45          Min.   :-3.00
##  Class :character   1st Qu.:18.91
##  Mode  :character   Median :23.16
##                     Mean   :21.90
##                     3rd Qu.:27.00
##                     Max.   :33.48

ggplot(temp, aes(x = reorder(city, temperature),
                 y = temperature, fill = temperature)) +
  geom_bar(stat = "identity", colour = "black") +
  scale_fill_gradient2(low = muted("blue"),
                       mid = "white", high = muted("red"),
                       midpoint = 25) +
  coord_flip() + theme_bw() + xlab('Capital') +
  theme(legend.position = c(0.9, 0.2)) +
  theme(legend.background=element_rect(
    fill="white", colour="grey77"))
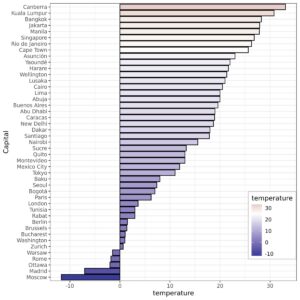
this is so simple we can do so many other things with the data using R.
but the purpose of this post is to show the capabilities the command line has in doing data science jobs.
Leave a Reply